


Did the record heat in 2017 affect this California wine?
Probably in a good way.

The summer of 2017 was difficult for California. The meteorological summer (Jun-Aug) was the warmest on record in much of the state. The hot summer resulted in a strong wildfire season with more than 9,000 individual fires that burned more than 1.5 million acres. We’ll talk more about the kinds of weather that lead to wildfires in a future post, but suffice it to say that they are often fueled by hot, dry conditions mixed with some kind of warm wind event (regional names vary but Santa Ana and Diablo are often used to describe these winds).
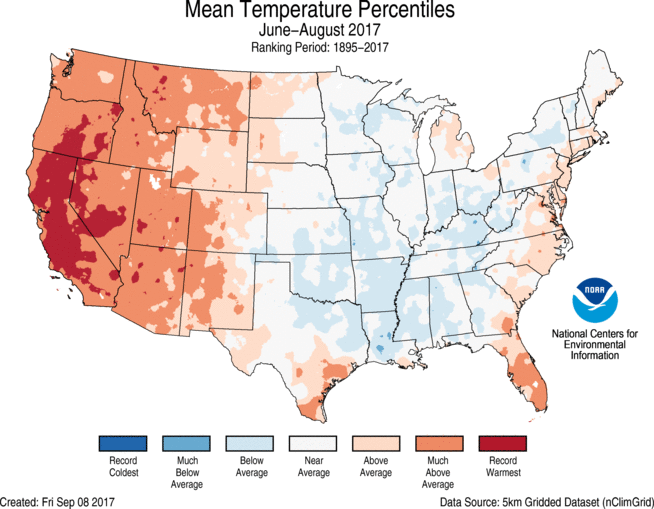
Fortunately for California’s wine country, most wildfires held off until mid-October by which time most of the grapes had been harvested. There are a number of articles detailing the fascinating resilience that the wine industry has in these difficult times, an important trait for the future when such wildfires are forecast to become more common. Since the wildfires don’t appear to be a major player in this week’s wine, I’d like to focus instead on the extreme heat that California endured.
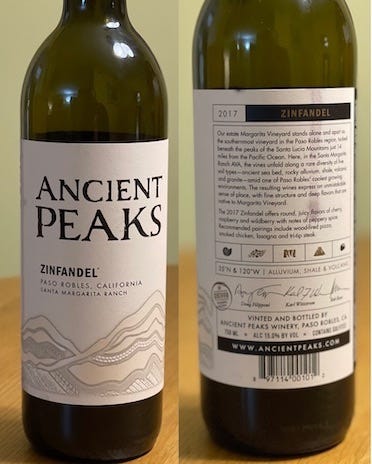
This week’s wine is a 2017 Zinfandel from Ancient Peaks, which is based in San Luis Obispo County, California. Its vineyard is the only one in the Santa Margarita Ranch AVA (American Viticulture Area). The vineyard is slightly under 100 miles northwest of Santa Barbara, located in a valley in the southern part of the county. The wine itself is delicious - the plum and pepper notes stood out to me the most, with much less of a tannic mouthfeel than I expected. Bold yet very smooth. How did the warm summer affect this wine?
Agriculture can be difficult to study meteorologically because the density of weather observations isn’t very high. Most official weather observations are kept at airports throughout the country. This is great for large-scale weather events, but weather that occurs in between the airports is lost, which includes most terrain induced phenomena. The map below shows the official observational stations in California. This map doesn’t actually have every single location, but it should give you a reasonable idea of how spread out the stations can be.
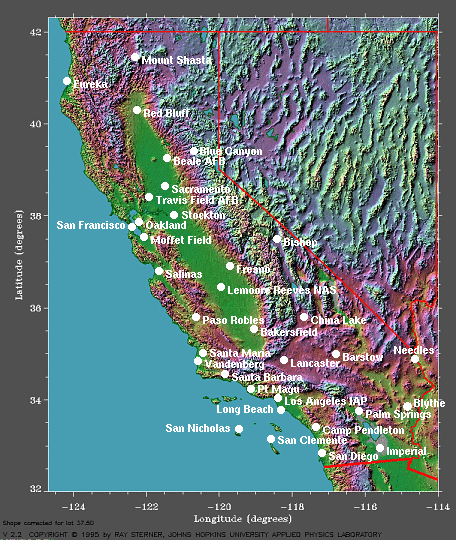
The biggest problem for me is that I can’t find any observations near the vineyards. The closest observational areas that I was able to find were the Paso Robles Airport (KPRB) and the San Luis Obispo County Airport (KSBP). The Paso Robles airport is about 40 miles due north of the County Airport and neither is within the Santa Margarita valley. The County Airport is considerably closer to the coast. Nevertheless, this is the best freely available data (see footnote for more information about the data and analysis) that I could find, so we’ll have to make do.
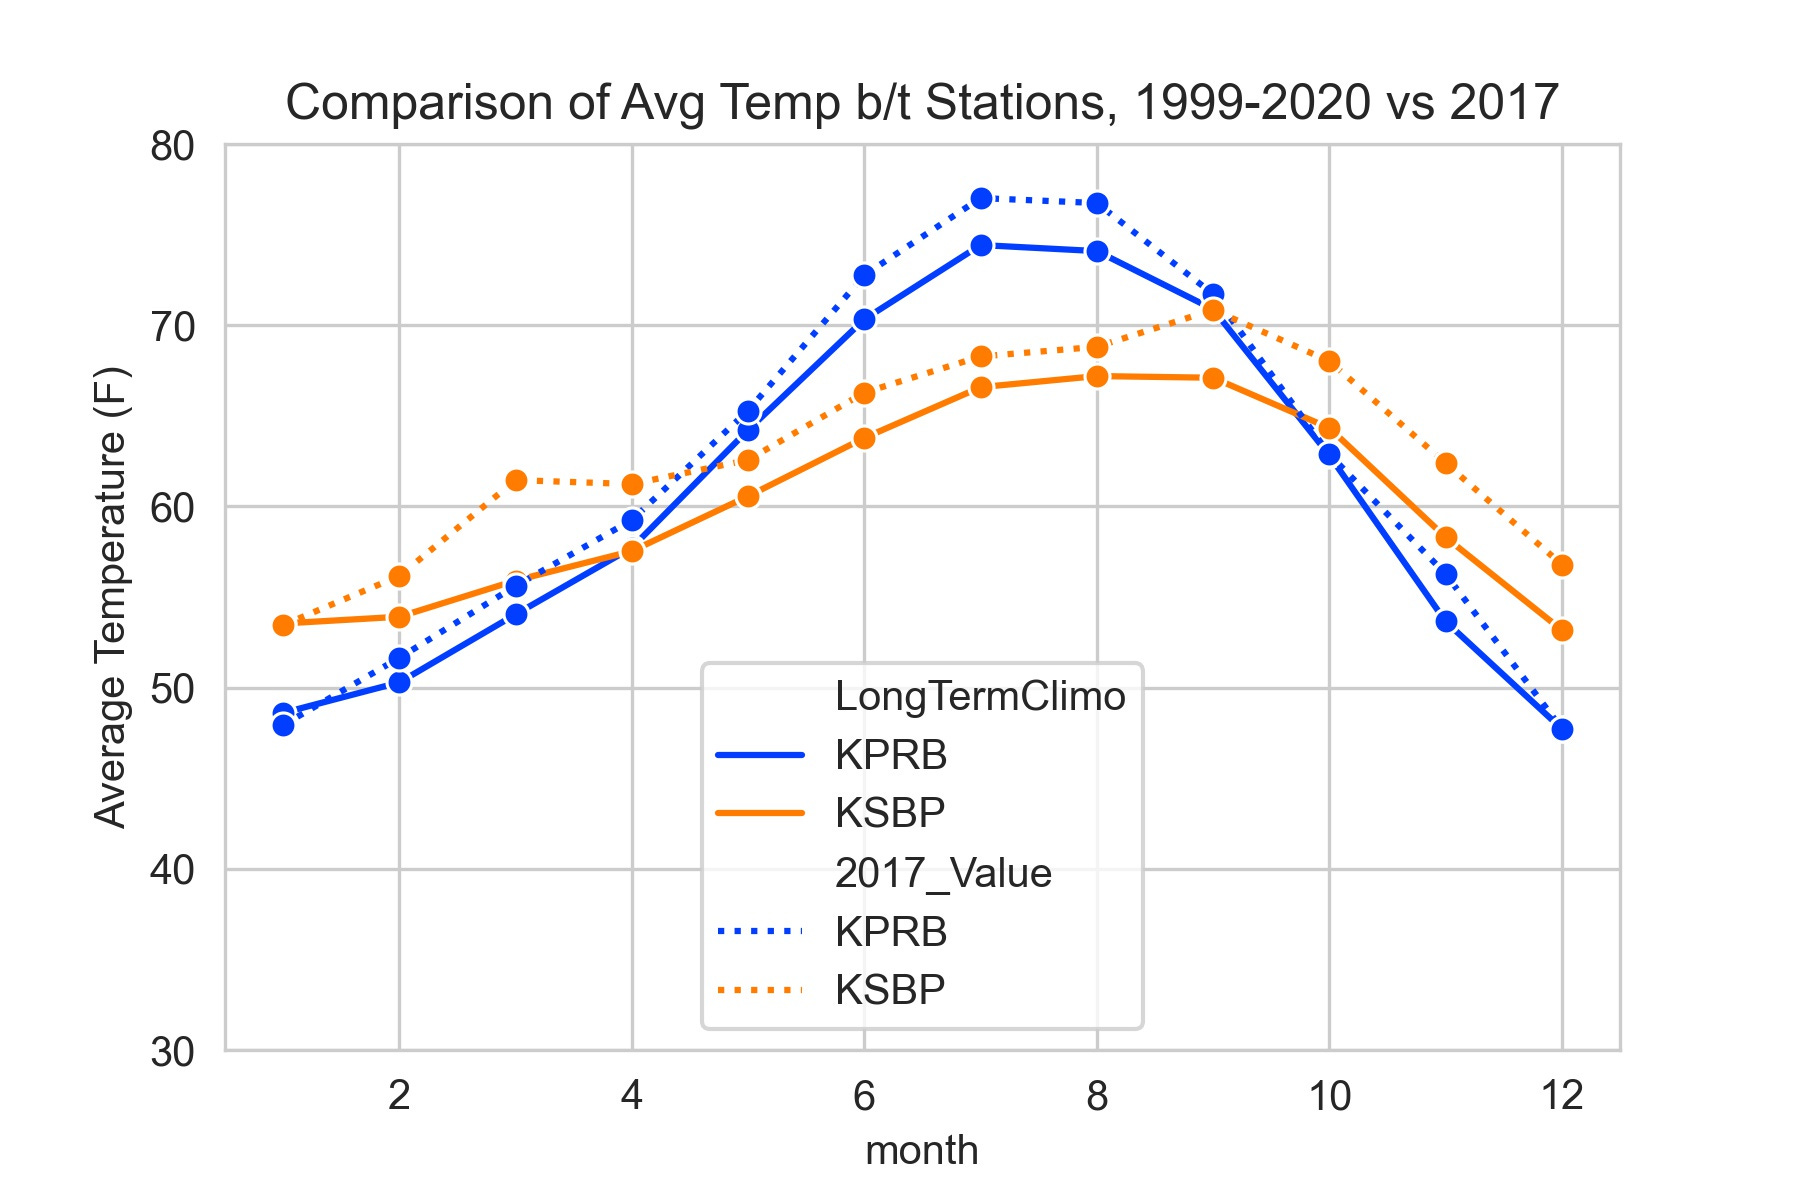
Above is a graph showing the long term average temperatures at each airport (solid lines) compared to the 2017 temperatures (dotted lines). There are considerable regional differences. The northern airport, Paso Robles, is warmer than the County Airport during the summer and cooler during the winter. Why is that?
The simplest explanation is that the Paso Robles airport is further inland than the County Airport, shielded from the immediate effects of the ocean. Since water has a significantly higher heat capacity than air, it is much more resistant to changes in temperature, resulting in very little seasonal variability. This is the main reason that so much of the West Coast has a temperate climate.
As expected, 2017 was warmer than the long term climatology at both airports. One popular way to measure the amount of heat during a particular season is to calculate growing degree days (GDDs). GDDs are defined as the difference between the average daily temperature and some threshold, usually 50°F (10°C). So, if the average temperature for today were 65°F, then today would have 15 GDDs. We use these and similar units (e.g. heating and cooling degree days) all the time in meteorology throughout several industries (especially agriculture and energy).
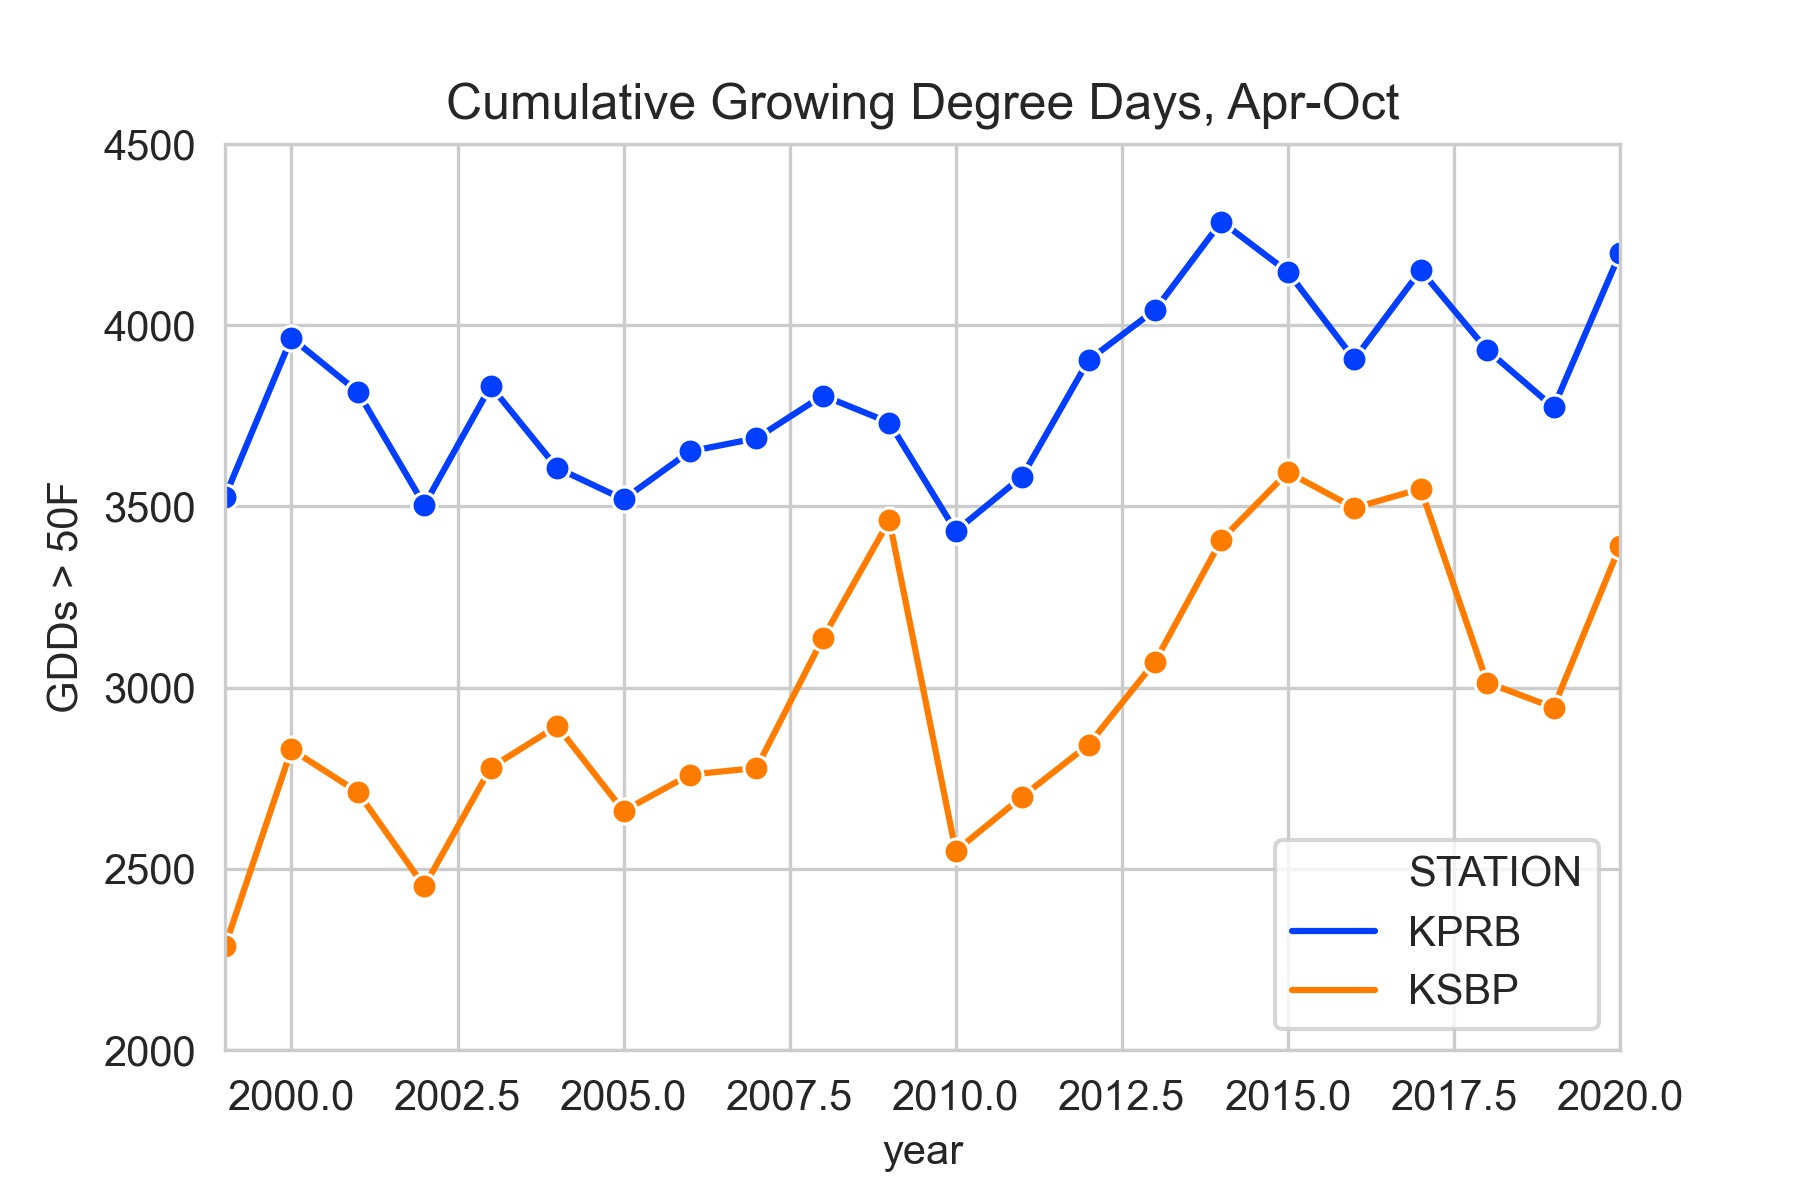
The graph above shows the total number of growing degree days during the core growing season of April - October for every year between 1999 and 2020. As we might expect, there are considerably more GDDs at Paso Robles every year than at the County Airport, which matches the summer temperature comparisons quite well. There are several interesting questions that we could pursue from this graph. Why are the stations so similar in 2009? Why does 2012-2020 appear to have more GDDs than 1999-2011? Is the answer as simple as global warming? What happened between 2015-2017? Hopefully we will tackle these questions as we explore weather and climate in future newsletters.
So, 2017 was hot and had among the highest GDDs at both stations. I think it’s reasonable to conclude that the vineyard also shared these characteristics during 2017 (with actual values closer to KSBP than KPRB). The last important metric to consider is the diurnal cycle, which is simply the difference between the daily maximum and minimum temperatures. Larger diurnal cycles imply hotter days and colder nights than smaller diurnal cycles. You’ll notice that the coastal station has a much smaller diurnal cycle than the inland station, an effect of the ocean’s moderating abilities. There isn’t a significant difference between the long term average and 2017, but an argument could be made that temperature swings in the summer were slightly above average while swings the fall were below average.

So how did the warmth affect the wine? Interestingly, Vivino’s ratings highlight the 2017 vintage as having the highest rating compared to any other year for this particular wine. Zinfandel grapes require a large diurnal cycle, which was especially pronounced during the summer of 2017.
So where does this leave us? First, 2017 was among the hottest years in California’s history… but that didn’t seem to adversely affect this wine. In fact, this vintage was the best rated! Santa Margarita, like many wine regions, is well insulated from the annual weather variability. The 2017 temperature and GDDs throughout the region were only slightly higher than average, despite the entire state having a record warm year. This year-to-year consistency is extremely important to vineyards around the world and creates a clear distinction between conventional wine regions and those in more variable climates, like upstate New York or Virginia.
Next week we’ll explore a more general theme: how does El Niño affect global wine growing regions? Stay tuned!
Data availability statement: All data and analyses in each newsletter will be available on my GitHub page for anyone that wants to wade through my Python code to see where the graphs and maps come from. This week’s data was downloaded from NOAA.