


Laying the foundation: El Niño and La Niña

One of the biggest secrets of meteorology is that nearly everything related to weather can be explained by temperature variations around the globe. We refer to these temperature variations as gradients and they exist everywhere on earth in every direction: north, east, south, west, up, and down. Some of the most important temperature gradients exist along coastlines (why the beach is breezy) and mountain ranges. You can also find temperature gradients in the oceans, especially the Pacific.
Under normal conditions, the warmest part of the Pacific Ocean is around Indonesia, a place often referred to as the Pacific Warm Pool. The temperature gradient extends east and the coldest waters are found off the west coasts of Ecuador and Peru. During summer, the temperature difference, on average, is around 18°F (10°C). I’ve annotated a figure below showing this gradient.

Like most things in the atmosphere, the temperature gradient isn’t constant. It changes in an oscillating fashion called the El Niño Southern Oscillation (ENSO); it’s most often measured in monthly increments.
La Niña occurs when the cold water in the east Pacific gets colder (and sometimes the warm water around Indonesia gets warmer) for at least 3 consecutive months. This strengthens the temperature gradient. An El Niño exists when the cold water in the east Pacific gets warmer for at least 3 consecutive months, which weakens the temperature gradient. At a high level, that’s all ENSO is. It’s deceptively simple, but globally significant.
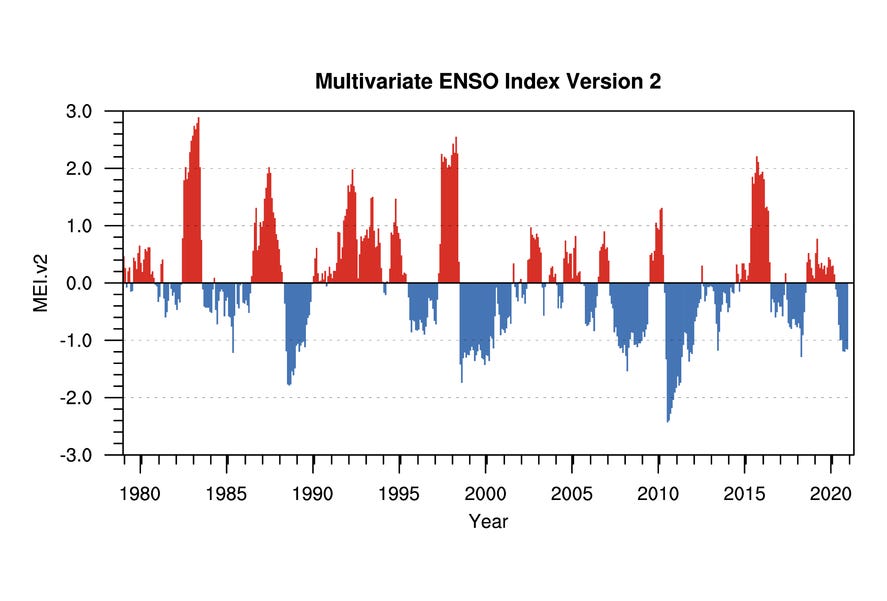
The graph above shows El Niño events (red) and La Niña events (blue) since 1980. You’ll notice that ENSO oscillates irregularly, so each El Niño and La Niña begins at different times, lasts for different lengths of time, and ends at different times. Sometimes you can even get two in a row. The irregularity makes things especially difficult to predict.
So, why do we care about El Niño and La Niña in this newsletter? Well, it turns out that as the temperature gradient in the ocean changes, so does the flow in the atmosphere. In fact, changes to the water temperature create atmospheric patterns that emanate out of the tropical Pacific and affect the entire world.

Above is an image from climate.gov showing the typical impacts of La Niña on the U.S. during winter. Since each La Niña is different, these impacts don’t always happen, but most La Niña winters are similar to this.
You might think that this looks familiar. That’s because this year is a La Niña year. La Niña conditions began in fall of 2020 and are forecast to continue at least through spring 2021. If you’re wondering what the best forecast for the rest of the winter is… the image above is a great place to start!
In the next newsletter we’ll tie ENSO to wine and explore two wines from two very different parts of the globe that were impacted by ENSO. We’ll discuss a Shiraz from South Australia and a Malbec from Mendoza, Argentina. Exploring wines from previous La Niña years might give us an idea of what to expect from the 2021 vintages. Stay tuned!